We have been on a hot streak lately with two 100% gainers in the last month. Now we believe it's time for a third. On October 21 we wrote a bullish article on Surge Battery Metals Inc. (NILI.V) (NILIF) while it was trading at $0.10. It has since risen 175% to $0.275. On November 22, we wrote a bullish call on Fission 3.0 Corp. (FUU.V) (FISOF) when the stock traded at $0.12. It's up to $0.29, but we recommended to take profits at another double a few days ago. The third stock we think can be another 100% or more runner is Equity Metals Corporation (EQTY.V) (EQMEF) after it rose 47% to close at $0.11 on Thursday after some excellent news. We are up to 1,008 followers on our ValueTrades blog despite not giving out a lot of alerts, a fact that we think is indicative of a successful, diligent and prudent stock picking history. If you like our picks you can also follow this blog by clicking the follow button on the top of the left hand panel. We have 102 followers so far on here. You can also follow us on Twitter @StockTradePicks which has over 5,000 followers.
After the news of this past week, we think a fair price target on NILI is $0.75. A fair price target on EQTY is $0.50. We don't have a price target on FUU anymore as we have sold out, but wish investors continued luck. For comparison, EQTY's market cap is $11 million, NILI's market cap is $26 million and FUU's market cap is $88 million. Yes, it's hard to compare a precious metals explorer to a lithium explorer to a uranium explorer. But the targets we have for NILI and EQTY would still imply lower market caps than FUU's today. FUU has a bright future, but these other two stocks have greater upside at these relative prices.
We will get to NILI later, but first we will review EQTY's press release from this past week as the bullish thesis is short and straightforward:
Equity Metals Announces a Significant Increase to the Mineral Resource Estimate at the Silver Queen Project, BC
Highlights
Increase in Indicated Category by 187% to 62.8Mozs AgEq or by 214% to 765Kozs AuEq: 21.0Mozs Ag (+297%), 237Kozs Au (+179%), 18Mlbs Cu (+288%), 48Mlbs Pb (+178%) and 267Mlbs Zn (+134%)
Increase in Inferred Category by 30% to 22.5Mozs AgEq or by 41% to 273Kozs AuEq: 10.3Mozs Ag (+117%), 50Kozs Au (-21%), 10Mlbs Cu (+79%), 23Mlbs Pb (+45%) and 84Mlbs Zn (-9%)
Vancouver, British Columbia--(Newsfile Corp. - December 1, 2022) - Equity Metals Corporation (TSXV: EQTY) ("Equity" or "Company") reports that Kirkham Geosystems Ltd ("KGL") and P&E Mining Consultants Inc. ("P&E") have completed an updated Independent Mineral Resource Estimate ("MRE") for the Silver Queen Project, British Columbia, Canada. The MRE features lateral and down-dip extensions of the previously modelled No. 3 and NG-3 Veins, originally included in the 2019 MRE, and new, previously unmodelled mineralization from the Camp and Sveinson Targets. The MRE utilizes a Net Smelter Return ("NSR") cut-off at C$100/t with updated metal pricing.
President Joe Kizis comments, "At the time we assumed management of the Company in Q3 of 2019, we felt there were clear opportunities to quickly add significantly to the 2019 MRE at Silver Queen, and we are proud to report our success at a very low cost of $0.15/oz of added AgEq or $11/oz of added AuEq. The MRE remains open for additional delineation west of the Camp Target and within the Sveinson Target. In addition, there are several targets that have only been tested by a few drill holes and remain very attractive areas for new discoveries and MRE increase."
Silver Queen Resource Model highlights:
Compared to the 2019 Mineral Resource Estimate, the 2022 update, at a C$100/t NSR cut-off, features:
- A 2.6Mt increase in Indicated Mineral Resources to 3.46Mt averaging 189g/t Silver, 2.13g/t Gold, 0.24% Copper, 0.6% Lead and 3.5% Zinc (565g/t AgEq or 6.9g/t AuEq) containing:
21.0 million ounces of silver; 237 thousand ounces of gold; 18 million pounds of copper; 48 million pounds of lead; and 267 million pounds of zinc.
This equates to 62.8 million ounces silver equivalent or 767 thousand ounces of gold equivalent; and
- A 1.1Mt increase in Inferred Mineral Resources to 1.92Mt averaging 162g/t Silver, 0.80g/t Gold, 0.23% Copper, 0.5% Lead and 2.0% Zinc (356g/t AgEq or 4.3g/t AuEq) containing:
10.3 million ounces of silver; 50 thousand ounces of gold; 10 million pounds of copper; 23 million pounds of lead; and 84 million pounds of zinc.
This equates to 22.5 million ounces silver equivalent or 273 thousand ounces of gold equivalent.
The updated MRE incorporates an additional 25,659 metres of core drilling completed in 2020-22 and updated metal recoveries and pricing.
Silver Queen Project Highlights
- A total of 78 drill holes for 25,659 metres was completed by the Company on the Silver Queen Project in six successive phases of exploration starting in late 2020. Five separate target areas have been tested in part and thick intervals of high-grade gold, silver and base-metal mineralization have been identified in each of the Camp Vein, the Sveinson Target, No. 3 Vein, and NG-3 Vein systems.

Figure 1: Plan map of targets and deposits on the Silver Queen vein system, BC
To view an enhanced version of Figure 1, please visit:
https://images.newsfilecorp.com/files/5566/146367_9a17d757e49a3999_002full.jpg
The updated NI 43-101 Mineral Resource Estimate increases the tonnage by approximately 240% with the increase being from the result of revised metal pricing, the extension to the NG-3 Deposit and the addition of mineralization from the Camp and Sveinson Veins.
Approximately 64% of the Mineral Resources are classified as Indicated Resources on a per tonnage basis and 74% of the total on a AgEq basis reflecting the overall higher average grade (565g/t AgEq) of the MRE in the Indicated category.
The Mineral Resource has a strong precious-metal bias with gold and silver accounting for approximately 64% of the total value.
The Mineral Resource update features a significant increase in contained silver ounces in both the Indicated (+297%) and Inferred (+117%) categories, which is supported in large part by the addition of strongly silver enriched mineralization from the Camp Veins.
The company has expended C$6.75 million on exploration of the Silver Queen project since 2019 resulting in a cash-discovery-cost of only C$0.15/oz per AgEq added or C$11/oz AuEq added.
Tabulation of grades and tonnages sensitivities (Table 2) demonstrate an excellent retention of higher-grade mineralization at increasing C$NSR cut-offs with 84% of the Base-case Mineral Resource when expressed on a AgEq basis remaining at a C$200 NSR cut-off.
Vein Target Specifics
Drilling on the Camp Target identified a conjugate vein set comprising steep southwest-dipping, strongly silver-enriched veins and steep north-dipping, gold-enriched polymetallic veins. Individual veins demonstrate good lateral continuity over +150 metre strike-lengths within an overall cumulative strike-length of the target of approximately 300 metres. Drilling confirmed continuity of the vein sets to depths of up to 195 metres, with several veins extending laterally to the east and projecting into the Sveinson Target.
The Sveinson Target includes the previously identified No. 5 and Switchback Veins and forms a broad, 150 metre wide, veined structural corridor that projects laterally eastward for over 1000 metres where it transitions into the No. 3 Vein system. Drilling successfully intersected multiple shallow veins at less than 100 metres below surface as well as several deeper vein intercepts at over 350 metres below surface. Numerous veins have been encountered across the full 150 metre width of the Sveinson Structural Zone, with several individual vein segments demonstrating good lateral continuity along 200 to 400 metre strike lengths.
The No. 3 Vein system, strikes northwest to southeast and dips to the northeast at approximately 60 degrees. The average width of the veins is 0.9 to 1.2 metres with local increases up to about 4.6 metres. The No. 3 Vein can be traced on surface and in drilling for over a 1.2 kilometre strike length where it transitions across an oblique structure and into the NG-3 Vein system.
The NG-3 Target forms the southeast extension of the No. 3 Vein and was tested with eight core holes which returned several intersections of high-grade gold and silver. Equity's drilling has now confirmed the extension of the NG-3 Vein to over 300 metres of strike and to depths of up to 240 metres below surface. The drill holes have established internal continuity between widely spaced historical intercepts drilled by previous management and earlier drilling by Equity. Mineralization remains open along strike and down dip.
Mineral Resources that are not Mineral Reserves do not have demonstrated economic viability. Inferred Resources are considered too speculative geologically to have economic considerations applied to them that would enable them to be classified as Mineral Reserves. An Inferred Mineral Resource has a lower level of confidence than that applying to an Indicated Mineral Resource and must not be converted to a Mineral Reserve. It is reasonably expected that the majority of Inferred Mineral Resources could be upgraded to Indicated Mineral Resources with continued exploration.
A NI 43-101 Technical Report will be posted on SEDAR within 45 days.
Table 1: Base Case Mineral Resource Estimate for the Silver Queen Project Utilizing a C$100/t NSR cut-off value
| Indicated Resources | Average Grade | |||||||
| Zone | Tonnes | Ag | Au | Cu | Pb | Zn | AgEq | AuEq |
| (kt) | (g/t) | (g/t) | (%) | (%) | (%) | (g/t) | (g/t) | |
| No. 3 and NG3 Veins | 2,942 | 150 | 2.45 | 0.25 | 0.7 | 3.8 | 569 | 6.9 |
| Camp Vein | 514 | 412 | 0.31 | 0.19 | 0.4 | 1.5 | 541 | 6.5 |
| Total | 3,455 | 189 | 2.13 | 0.24 | 0.6 | 3.5 | 565 | 6.9 |
| Inferred Resources | Average Grade | |||||||
| Zone | Tonnes | Ag | Au | Cu | Pb | Zn | AgEq | AuEq |
| (kt) | (g/t) | (g/t) | (%) | (%) | (%) | (g/t) | (g/t) | |
| No. 3 and NG3 Veins | 257 | 110 | 1.94 | 0.32 | 0.2 | 1.1 | 361 | 4.4 |
| Camp Vein | 1,664 | 176 | 0.64 | 0.22 | 0.6 | 2.1 | 366 | 4.4 |
| Total | 1,920 | 167 | 0.82 | 0.23 | 0.5 | 2.0 | 365 | 4.4 |
| Indicated Resources | Contained Metal | |||||||
| Zone | Tonnes | Ag TrOz | Au TrOz | Cu | Pb | Zn | AgEq TrOz | AuEq TrOz |
| (kt) | (kozs) | (kozs) | (Mlbs) | (Mlbs) | (Mlbs) | (kozs) | (kozs) | |
| No. 3 and NG3 Veins | 2,942 | 14,168 | 232 | 16 | 43 | 249 | 53,852 | 657 |
| Camp Vein | 514 | 6,808 | 5 | 2 | 5 | 17 | 8,940 | 108 |
| Total | 3,455 | 20,976 | 237 | 18 | 48 | 267 | 62,792 | 765 |
| Inferred Resources | Contained Metal | |||||||
| Zone | Tonnes | Ag TrOz | Au TrOz | Cu | Pb | Zn | AgEq TrOz | AuEq TrOz |
| (kt) | (kozs) | (kozs) | (Mlbs) | (Mlbs) | (Mlbs) | (kozs) | (kozs) | |
| No. 3 and NG3 Veins | 257 | 911 | 16 | 2 | 1 | 6 | 2,975 | 36 |
| Camp Vein | 1,664 | 9,387 | 34 | 8 | 22 | 78 | 19,562 | 237 |
| Total | 1,920 | 10,298 | 50 | 10 | 23 | 84 | 22,536 | 273 |
1) The current Mineral Resource Estimate was prepared by Garth Kirkham, P.Geo., of Kirkham Geosystems Ltd and Eugene Puritch, P. Eng., FEC, CET and Fred Brown, P, Geo. of P&E Mining Consultants Inc. ("P&E"), Independent Qualified Persons ("QP"), as defined by National instrument 43-101.
2) All Mineral Resources have been estimated in accordance with Canadian Institute of Mining and Metallurgy and Petroleum ("CIM") definitions, as required under National Instrument 43-101 ("NI43-101").
3) Mineral Resources were constrained using continuous mining units demonstrating reasonable prospects of eventual economic extraction.
4) Silver and Gold Equivalents were calculated from the interpolated block values using relative process recoveries and prices between the component metals and silver to determine a final AgEq and AuEq values.
5) Silver and Gold Equivalents and NSR$/t values were calculated using average long-term prices of $20/oz silver, $1,700/oz gold, $3.50/lb copper, $0.95/lb lead and $1.45/lb zinc. All metal prices are stated in $USD. The C$100/tonne NSR cut-off grade value for the underground Mineral Resource was derived from mining costs of C$70/t, with process costs of C$20/t and G&A of C$10/t. Process recoveries used were Au 70%, Ag 80%, Cu 80%, Pb 81% and Zn 90%.
6) Grade capping was performed on 1m composites for the No. 3 and NG-3 veins and whole vein composites for the Camp and Sveinson veins. For the No. 3 and NG-3 veins Inverse distance cubed (I/d3) was utilized for grade interpolation for Au and Ag and inverse distance squared (I/d2) was utilized for Cu, Pb and Zn. Inverse distance squared (I/d2) was used for all metals in the Camp and Sveinson veins.
7) A bulk density of 3.56t/m3 was used for all tonnage calculations in the No. 3 and NG-3 veins. A variable density with a 3.15 average was used for the Camp and Sveinson veins.
8) Mineral Resources are not Mineral Reserves until they have demonstrated economic viability. Mineral Resource Estimates do not account for a Mineral Resource's mineability, selectivity, mining loss, or dilution.
9) An Inferred Mineral Resource has a lower level of confidence than that applying to an Indicated Mineral Resource and must not be converted to a Mineral Reserve. It is reasonably expected that the majority of Inferred Mineral Resources could be upgraded to Indicated Mineral Resources with continued exploration.
10) All figures are rounded to reflect the relative accuracy of the estimate and therefore numbers may not appear to add precisely.
Table 2: Resource Model Sensitivities at Various C$NSR/t cut-offs
| C$NSR Cut-offs | Tonnes (kt) | Ag (g/t) | Au (g/t) | Cu (%) | Pb (%) | Zn (%) | AgEq (g/t) | AuEq (g/t) | Ag TrOz (kozs) | Au TrOz (kozs) | Cu (Mlbs) | Pb (Mlbs) | Zn (Mlbs) | AgEq TrOz (kozs) | AuEq TrOz (kozs) |
| CAD$50NSR | |||||||||||||||
| Indicated | 4,031 | 167 | 1.89 | 0.22 | 0.6 | 3.1 | 503 | 6.1 | 21,642 | 244 | 20 | 51 | 279 | 65,233 | 795 |
| Inferred | 2,307 | 146 | 0.74 | 0.21 | 0.5 | 1.8 | 327 | 4.0 | 10,825 | 55 | 11 | 26 | 92 | 24,219 | 294 |
| CAD$100NSR | |||||||||||||||
| Indicated | 3,455 | 189 | 2.13 | 0.24 | 0.6 | 3.5 | 565 | 6.9 | 20,976 | 237 | 18 | 48 | 267 | 62,792 | 765 |
| Inferred | 1,920 | 167 | 0.82 | 0.23 | 0.5 | 2.0 | 365 | 4.4 | 10,298 | 50 | 10 | 23 | 84 | 22,536 | 273 |
| CAD$150NSR | |||||||||||||||
| Indicated | 2,833 | 215 | 2.46 | 0.25 | 0.7 | 3.9 | 642 | 7.8 | 19,569 | 224 | 16 | 44 | 246 | 58,440 | 712 |
| Inferred | 1,230 | 8372 | 39.09 | 0.29 | 0.6 | 2.3 | 449 | 5.4 | 9,203 | 42 | 8 | 16 | 63 | 17,749 | 215 |
| CAD$200NSR | |||||||||||||||
| Indicated | 2,346 | 239 | 2.78 | 0.27 | 0.8 | 4.3 | 712 | 8.7 | 17,989 | 210 | 14 | 39 | 224 | 53,709 | 654 |
| Inferred | 851 | 250 | 1.15 | 0.34 | 0.6 | 2.5 | 515 | 6.2 | 6,837 | 31 | 6 | 11 | 47 | 14,080 | 171 |
1) Sensitivities were calculated at progressive C$NSR/t cut-off utilizing the same parameters and metal pricing as the Base Case scenario described in Table 1.
Silver, Gold Equivalencies and C$NSR Calculations
Silver and Gold Equivalents and NSR$/t values were calculated using approximate average long-term prices of $20/oz silver, $1,700/oz gold, $3.50/lb copper, $0.95/lb lead and $1.45/lb zinc. All metal prices are stated in $USD with a conversion to $CAD of 0.77. See below the equivalency and C$NSR calculations:
AgEq = (Ag g/t x 1) + (Au g/t x 81.41) + (Cu% x 116.35) + (Pb% x 28.77) + (Zn% x 44.80)
AuEq = (Ag g/t x 0.012) + (Au g/t x 1) + (Cu% x 1.43) + (Pb% x 0.35) + (Zn% x 0.55)
C$NSR = (Ag g/t x 0.57) + (Au g/t x 46.79) + (Cu% x 66.87) + (Pb% x 16.54) + (Zn% x 25.74)
In short, this resource estimate comes out to over one million ounces of indicated and inferred gold equivalents. Similar type of projects belong to companies with $50 to $100 million market caps. A $0.50 stock price would put EQTY on the lower end of that range. We expect the stock to gain momentum over the next several days as this great news gets disseminated.
If you look at the 5 year chart on EQTY, you'll notice a massive run to over $3.00 from $0.40 that took place in the matter of a couple of days in October 2017. Two months later the stock cratered and gave most of that back. This was on hype of a drill hole completed at the Silver Queen Project. The results disappointed in the end. Fast forward five years and now the project has a significant defined resource while it is trading at a mere $0.11 or $11 million market cap. If it can takeoff to the moon back then, EQTY certainly had a shot to take off to the moon once again now.
Next up is NILI, and the incredible results it released in Thursday's press release:
December 1, 2022 – TheNewswire - Coquitlam, BC - Surge Battery Metals Inc. (the “Company” or “Surge”) (TSXV:NILI ) , ( OTC:NILIF ) , ( FRA:DJ5C) is pleased to announce assay results from four drill holes at their 100% owned Nevada North Lithium Project in Elko County, Nevada. Assay results returned multiple zones of strong values ranging from 1,000 ppm to 5,000 ppm lithium confirming the potential for a high tenor lithium clay deposit.
The tables below list the significant intercepts in each hole. Averages were calculated using a 1,000-ppm lithium cut off value with no internal dilution. All holes were drilled vertically using reverse circulation percussion drilling methods.
Hole ID | From ft | To ft | From M | To M | Thickness ft | thickness M | Avg Li ppm |
NN2203 | 5 | 120 | 1.52 | 36.57 | 120 | 35.05 | 4008 |
NN2203 | 170 | 200 | 51.81 | 60.96 | 30 | 9.15 | 3210 |
NN2203 | 235 | 250 | 71.62 | 76.2 | 15 | 4.58 | 1480 |
Hole ID | From ft | To ft | From M | To M | Thickness ft | thickness M | |
NN2204 | 0 | 100 | 0 | 30.48 | 100 | 30.48 | 3929 |
NN2204 | 135 | 170 | 41.15 | 51.81 | 35 | 10.66 | 2563 |
NN2204 | 210 | 215 | 64 | 65.53 | 5 | 1.53 |
Hole ID | From ft | To ft | From M | To M | Thickness ft | thickness M | Avg Li ppm |
NN2205 | 0 | 115 | 0 | 35.05 | 115 | 35.05 | 4000 |
NN2205 | 155 | 190 | 47.24 | 57.91 | 35 | 10.67 | 2020 |
NN2205 | 220 | 240 | 67.05 | 73.15 | 20 | 6.1 | 2216 |
Holes NN2203, NN2204, and NN2205 were drilled along a ridgeline capped by a thin layer of silicious tuff and flanked by strongly anomalous soil samples. The holes were spaced about 120 meters apart in some of the strongest parts of the soil anomaly.
Mineralization is found in three distinct horizons of silty, weakly calcareous, claystone and with seams of blue-grey clay. Sedimentary textures are not well preserved in the chips, so the depositional environment is not clear but is thought to be in a lakebed environment. Rocks between the productive horizon are mostly reduced felsic air fall tuffs and tuffaceous siltstone. All holes ended in coarse cobble to pebble conglomerate or ash flow tuff. The lower tuff shows moderate propylitic alteration with replacement of mafic minerals by chlorite and disseminated pyrite.
Hole ID | From ft | To ft | From M | To M | Thickness ft | thickness M | Avg Li ppm |
NN2202 | 0 | 10 | 0 | 3.05 | 10 | 3.05 | 2065 |
NN2202 | 50 | 65 | 15.24 | 19.81 | 15 | 4.57 | 1295 |
Hole NN2202 was drilled on the eastern edge of the soil geochemical anomaly and while intersecting thin zones of moderate grade, seems to partially define the eastern extent of the mineralization.
As previously reported, partial, representative “rush” assay samples from drill hole NN2201 returned values in the productive clay/silt unit ranging from 1460 to 4500 ppm lithium. The full results from this “discovery” hole have not been received to date and should be processed by the lab shortly. Results from drill holes NN2206, NN2207, and NN2208 are being processed and results will be released as they become available.
Drill hole NN2206 tested the eastern edge of the soil anomaly and intersected about 15 meters (45 feet) of the productive clay/siltstone unit. Hole NN2207, drilled 490 meters south of NN2201, cut over 120 meters (400 feet) of the permissive claystone in four horizons. NN2208, the last hole of the 2022 program cut 72 meters (240 feet) of the productive horizons. Results of these holes are eagerly awaited.
While the property has several similarities to the Thacker Pass Deposit, the Nevada North Lithium Project is located some 290 km east of the McDermitt Caldera in what is likely a completely new lithium district.
The company made reference to Thacker Pass, despite being in an entirely new region (therefore with upside potential being unlimited). We have to agree with this assessment. We have compared NILI to Nevada Sunrise Metals Corporation (NEV.V) in the past, with NEV sitting at a $20 million market cap today. These results absolutely blow NEV out of the water. NEV previous announced an 1,101 ppm lithium discovery over 730 feet. The problem with that is that NEV's discovery is mostly buried at the bottom of the hole with 2,218 ppm in the final 130 feet starting at 990 feet depth. Subtract this out from the discovery and the first 600 feet starting from 300 feet deep averages about 860 ppm. NILI used a cutoff of 1,000 ppm. If NEV has used the same cutoff in its reporting as NILI, it's entire discovery would be 130 feet of 2,218 ppm using this one hole as an example. That's a lower grade of similar length buried a thousand feet deep compared to NILI's first section of ~4,000 ppm discovery at surface across three holes. NILI should clearly be valued at 3-4x of NEV, leading to our $0.75 target.
An argument brought up by some naysayers is that Nevada Lithium Resources Inc. (NVLH.CN) 50% owned project actually has better grades. Well, let's review this, with a chart provided by NVLH in its press release on September 29:
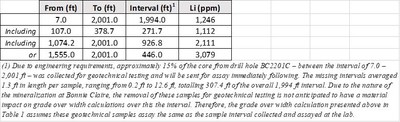
From 7 feet to 2001 feet, NVLH scored 1,246 ppm lithium. But it's the exact same song and dance as NEV. Most of that is buried in the final 446 feet at 3,079 ppm. The first 1,500 or so feet average 718 ppm. Again, below NILI's cutoff point. You can dig 100 feet deep and find more lithium in NILI's discovery than you will in the first 500 feet in NVLH's discovery. NILI's holes were dug to a depth of around the 250 to 400 feet range. We can't rule out that if NILI had bothered to drill as deep as 2,000 feet that it wouldn't have found something there as well. So again, NILI blows this discovery out of the water.
We have also seen ridiculous comparisons and rants from people whose egos are obviously much bigger than they deserve to be. Retired Boomers (the demographic with the most people who are never, ever wrong in their own minds) who think they should be the moderator and arbiter of what a good deposit is, like some kind of penny stock dictator:


As if Canada doesn't already have strict rules around NI 43-101 Qualified Person reporting and the lowly and gullible investors perusing message boards need extra special dissemination and hand-holding from the self-proclaimed and self-appointed "educated class" to help determine their investment decisions. We will take the word of NILI's Qualified Person Alan J. Morris who has gained that status after years of field work over some anonymous ego-thumper who claimed to have taught geology in a classroom. We don't usually point out individuals in a manner like this but the stench of arrogance on this bum and the effort they are willing to put in to try to trash NILI in what appears to be "smart" way is not something we can overlook. In this ridiculous proposal, is this "council" going to be bound to not buying or short-selling the stocks over which they seek to gain said rating power? Will there be some sort of legal reporting mechanism to track that, like SEDI reporting for insiders? Or should we just trust that this individual will be bound by the ethics of College of Teachers in Ontario while being a retired teacher to do the right thing and not use this rating system to try to benefit the positions they own?
The big stink against NILI this person is raising appears to be stemming from the already well-known debate between lithium carbonate created by evaporation from brines or mined out of clay (NILI's type of resource) and lithium hydroxide typically out of rock formations. This is what Investing News had to say about the debate:
"Lithium hydroxide’s popularity has been on the rise, at least in terms of making electric vehicle batteries. It is necessary for some types of cathodes, such as nickel-cobalt-aluminum oxide (NCA) and nickel-cobalt-manganese oxide (NCM). While lithium hydroxide has traditionally traded at a premium to lithium carbonate, in 2021 and into 2022 lithium carbonate prices have overtaken those of lithium hydroxide.
Demand for lithium has risen significantly in recent years due to the growing electric vehicle market, with some arguing that lithium hydroxide could outpace lithium carbonate in terms of demand growth in the future. However, as Andrew Miller of Benchmark Mineral Intelligence has explained, it’s going to take time before high-nickel cathodes such as NCA and NCM 811 take a more dominant position. That’s because there are a lot of technical and economic challenges in terms of bringing the cost down.
At the end of the day, with lithium demand expected to skyrocket, it’s becoming clear the world will need both."
So if someone says that hydroxide is higher priced than carbonate, they are lying. Or at least their truth is out-of-date. One thing to be aware of with retired teachers is that they are notoriously bad at continuous learning because they think what they learned back in 1974 is gospel. If Tesla is looking to secure supply, it will be looking in Nevada, Quebec and anywhere else it can find material amounts of lithium. Just because Musk may be looking in Quebec does not mean demand from Nevada is waning. It means even if Nevada is flowing at 100% capacity, it's still not enough. This can be a bullish argument for lithium companies in Quebec but it doesn't make it a bearish argument for lithium companies in Nevada.


The other big stink being raised is around Patriot Battery Metals Inc. (PMET.V) (PMETF). We don't even know what the point is of raising PMET into the discussion. It has a $725 million market cap. 28 times more than NILI. It BETTER have a superior resource to NILI given the significantly higher valuation. The stories aren't comparable right now and shouldn't be. We have already discussed two comparable peers above and a fair valuation for NILI with respect to them. Also, to use PMET and its higher valuation as ammunition to downplay the resource potential of NILI is just plain stupid. By that logic, clay projects should be worth so much more and rock projects worthless because Lithium Americas Corp. (LAC) has a market cap of $4.6 billion CAD, several times higher than PMET!
The appropriate comparables to NILI right now are companies like NEV and NVLH. Early stage Nevada-based lithium explorers. LAC is a pie-in-the-sky, everything goes right after several years upside potential comparable for NILI. PMET makes an excellent recent example of what can happen to a lithium stock that scores a significant resource - having risen 20x in a year - but as far as being an actual comparable to NILI, it's not. Good comparables for PMET are other rock formation lithium resources in Quebec. We hope that when people spew out streams of verbal diarrhea because their egos can't tolerate not hearing themselves type, that investors use their common sense in the assessment of these opinions on the lithium plays.

The constant spamming of bearish arguments and what-ifs. The chest thumping of unverifiable qualifications that borderline on the ridiculous (trust me bro, I was a geology teacher, I know things. I'm also on a first name basis with Eric Sprott). The desire for increased power without increased accountability with the council suggestion (trust me bro, I was a teacher, I’m honest). With these things we can only conclude with high probability that “slowride” is a shorter or working with a group that has an interest in seeing the price of NILI decline. The spamming and anonymous ego thumping is par for the course for message boards. But the sneaky power grab that was prompted by NILI's halt smells of nefarious intent. However, assuming this individual is associated with a desperate shorting consortium, this is actually a good thing. Leading to our final point about the announcement and subsequent rescinding of the private placement.
With further drill holes expected over the next few weeks, including full results from the first one, NILI is very likely to continue upwards on hype, in addition to the significant value it already has from what has been announced. The stock price actually dropped on Thursday after this great news for one reason and one reason only. The company announced a $0.10 private placement in conjunction with the drill results. After shareholders made their voices heard, the financing was dropped, and the stock shot up 49% on Friday in response. Investors bought shares back after selling, thinking they could either get back in cheaper or into the financing and instead ended up chasing. New investors watching the story unfold likely also bought in after witnessing a management team actually behave appropriately and pull an unneeded and unpopular financing. Finally, shorters likely played their financing games and got played, and now need to cover on the open market instead of buying into a financing in order to cover off the short position. We saw some of that potential on Friday with the price action as well as the desperation to flood the narrative with negativity. Expect more of that into next week as NILI continues its march to a fair value of $0.75.
Disclosure: We are long NILI.V, EQTY.V